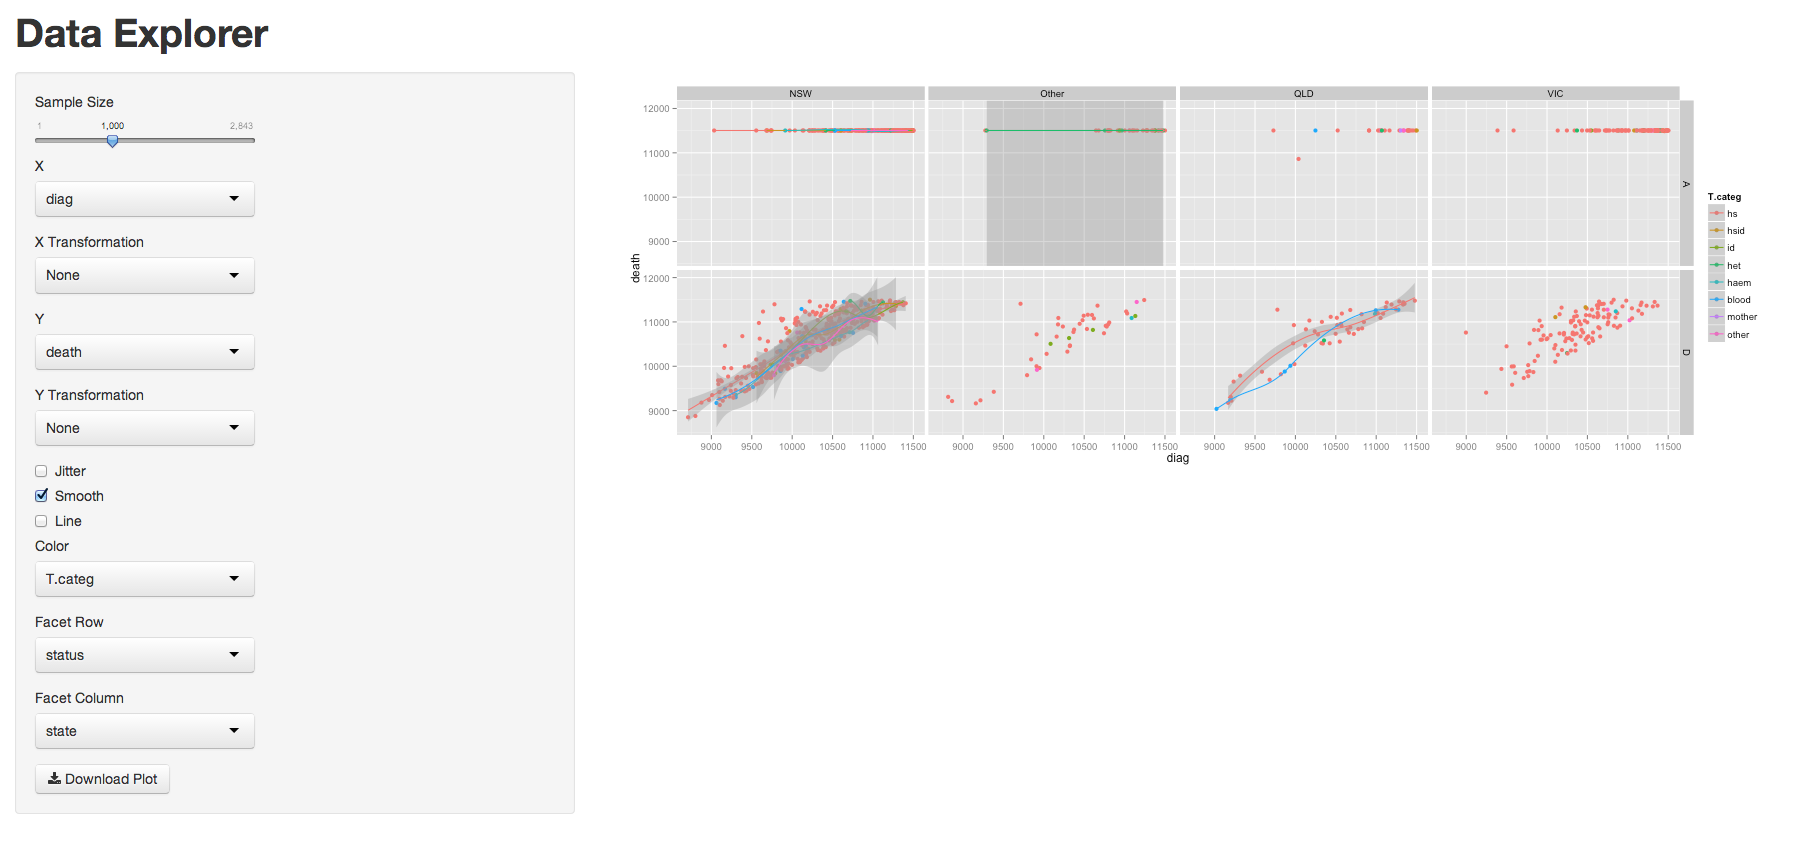
explr A shiny app for visualizing a data frame
explr is a simple but powerful interactive web app for visualizing a data frame in R. The sweet-spot for use cases is right when you get a new dataset and you just want to know what it looks like. explr allows you to see 5 dimensions (2 continuous by 3 discrete) in one screen by allowing faceting over column, row and color utilizing ggplot. Similarly, shiny allows the interactive selection of variables, transformations, and model fitting as well as a button for downloading a given plot. Example using the Aids2 dataset from the MASS library.